Configure dashboarding and alerts with Prometheus and Grafana
Grafana is an open-source data metrics tool that is used to aggregate large amounts of data into a comprehensive visual dashboard for easy analysis. This section includes instructions for installing Grafana on the local machine and configuring Telegram or Discord alerts for monitoring validator status on-the-go.

Getting account metrics
Ensure metrics have been activated by visiting the following dashboards:
- Node metrics are found at http://localhost:8080/metrics
- Validator metrics are found at http://localhost:8081/metrics
- Slasher metrics are found at http://localhost:8082/metrics
If you are using a custom --monitoring-host for these processes, such as an IP address, then just change localhost to the custom host you are using.
Note: Running a slasher isn't mandatory for staking, only people that are running a slasher can find the metrics at the port 8082. For those that don't run a slasher, all instructions that follow remain correct.
Installing Prometheus
Prometheus must first be installed to fetch the data from the Agora node and validator for Grafana to display.
Download the Prometheus files suited for the host system.
Extract the archive and enter it's new directory.
Locate the
prometheus.ymlfile and replace the contents with the following:
global:
  scrape_interval:     15s # Set the scrape interval to every 15 seconds. Default is every 1 minute.
  evaluation_interval: 15s # Evaluate rules every 15 seconds. The default is every 1 minute.
  # scrape_timeout is set to the global default (10s).
# Alertmanager configuration
alerting:
  alertmanagers:
  - static_configs:
    - targets:
      # - alertmanager:9093
# Load rules once and periodically evaluate them according to the global 'evaluation_interval'.
rule_files:
  # - "first_rules.yml"
  # - "second_rules.yml"
# A scrape configuration containing exactly one endpoint to scrape:
# Here it's Prometheus itself.
scrape_configs:
  - job_name: 'validator'
    static_configs:
      - targets: ['localhost:8081']
  - job_name: 'agora node'
    static_configs:
      - targets: ['localhost:8080']
- In the same directory, double-click the prometheus file (with extension
.exein Windows) to start Prometheus, or do so in a terminal by issuing the command:
./prometheus
A terminal will open presenting the Prometheus log.
NOTICE: Prometheus' default data logging time is 15 days. To extend dashboard statistics to 31 days, add
--storage.tsdb.retention.time=31dto this startup command.
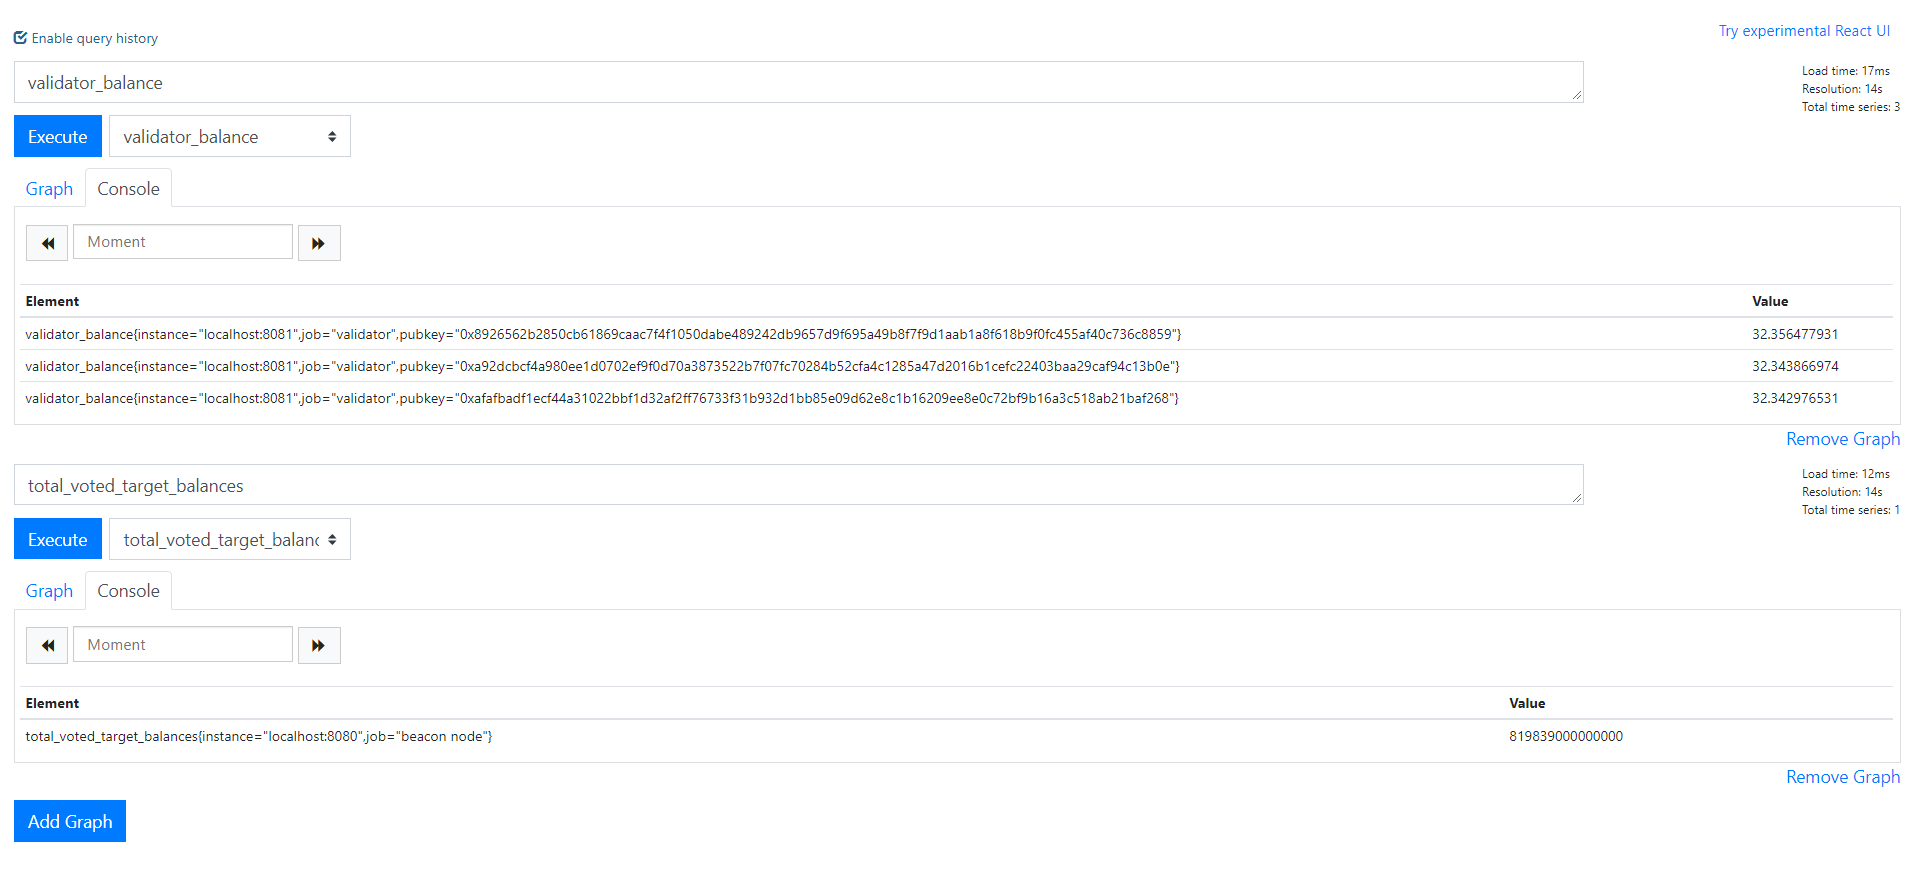
- Navigate to http://localhost:9090/graph in a browser. It will present a page similar to this:

Take note of the validator_statuses and total_voted_target_balances, as they are required later.
(Optional) Windows: Running Prometheus in the background
In a Windows Powershell prompt, navigate to the directory the prometheus.exe file is saved and issue the command:
Start-Process "prometheus.exe" "--storage.tsdb.retention.time=31d" -WindowStyle Hidden
To stop the prometheus process at any time, open the windows task manager and search for prometheus.exe, then end the task.
Installing Grafana
Grafana must now be installed to provide the graphical component of the data analytics.
Download Grafana and install it.
Open http://localhost:3000 in a browser. By default, the username and the password to this panel are both ‘admin’.
Create a data source and choose Prometheus, then enter in the URL field http://localhost:9090.
click on Save & Test.
A green notification saying “Datasource updated” should now be visible on the upper right corner.
Enabling mobile alerts
This section is currently out of date. Refer to Grafana's The new unified alerting system for Grafana for the latest alert configuration guidance while we update this content.
On the left menu of Grafana, select Notification channels under the bell icon.
Click on New channel.
Option 1: Telegram
Select Telegram from the list.
To complete the Telegram API settings, a Telegram channel and bot are required. For instructions on setting up a bot with
@Botfather, see this section of the Telegram documentation.Once completed, invite the bot to the newly created channel.
Option 2: Discord
Select Discord in the type drop down selection.
To complete the set up, a Discord server (and a text channel available) as well as a Webhook URL are required. For instructions on setting up a Discord's Webhooks, see this section of their documentation.
Navigate back to http://localhost:3000 and enter the Webhook URL in the Discord notification settings panel.
Click Send Test, which will push a confirmation message to the Discord channel.
Creating and importing dashboards
- The dashboard can now be customised to the users preferences. There are two examples that can be used:
- dashboard designed for small amount of validator keys
- dashboard designed for more than 10 validator keys
To import this json into the Grafana dashboard, click on the + icon on the left menu and select 'Import',
Paste the json and click the Load button.
Running nodes and validators on separate hardware
For those running their node and validators on separate machines, simply modify the pasted prometheus.yml data from the earlier step and change any instances of localhost to the desired IP. For local networks, the private IP is required. For connections over the internet, the public facing IP will be required.
NOTICE: In case of public IPs, port forwarding may need to be configured.